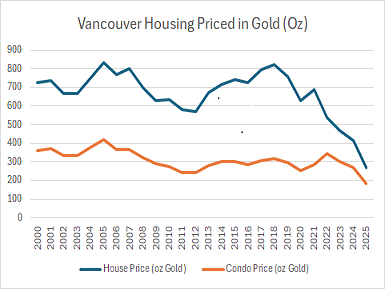
By Miika Makela | WBN Finance, WBN News Global, WBN News, WBN News Vancouver | May 22, 2025 |

Vancouver’s real estate market, one of Canada’s most expensive, has seen dramatic nominal price growth over the past 25 years, driven by limited supply, high demand, and global investment. However, when measured in ounces of gold—a stable store of value that mitigates fiat currency inflation—a starkly different picture emerges. This article analyzes Vancouver’s average house and condo prices from 2000 to April 2025, expressed in ounces of gold, using gold prices in USD converted to CAD with historical exchange rates. A comprehensive chart tracks these prices annually, revealing the market’s intrinsic value. Additionally, we explore the implications for investors, inflation, purchasing power, and the disconnect between housing, gold, and the Consumer Price Index (CPI), highlighting the decline in real incomes.

Methodology and Data Sources

To express real estate prices in ounces of gold, we divide the nominal home price (in CAD) by the annual average gold price (in CAD per ounce). Gold prices in USD are sourced from GoldBroker.com and cross-verified with TD Precious Metals. These are converted to CAD using annual average USD/CAD exchange rates from the Bank of Canada. Real estate prices are compiled from the Real Estate Board of Greater Vancouver (REBGV), Canadian Real Estate Association (CREA), and WOWA.ca. For April 2025, gold prices are based on the provided USD value ($3,200/oz) and estimated exchange rates from recent trends. Annual averages are used for consistency, with interpolation for missing data points. Calculations are rounded to whole numbers for simplicity.

Gold Prices and Exchange Rates

Gold prices in USD are converted to CAD using annual average USD/CAD exchange rates from the Bank of Canada:

·       2000: $279 USD/oz, 1.485 CAD/USD → $414 CAD/oz

·       2001: $271 USD/oz, 1.548 CAD/USD → $420 CAD/oz

·       2002: $310 USD/oz, 1.570 CAD/USD → $487 CAD/oz

·       2003: $363 USD/oz, 1.401 CAD/USD → $509 CAD/oz

·       2004: $410 USD/oz, 1.301 CAD/USD → $533 CAD/oz

·       2005: $444 USD/oz, 1.211 CAD/USD → $538 CAD/oz

·       2006: $601 USD/oz, 1.134 CAD/USD → $682 CAD/oz

·       2007: $697 USD/oz, 1.074 CAD/USD → $748 CAD/oz

·       2008: $872 USD/oz, 1.066 CAD/USD → $929 CAD/oz

·       2009: $972 USD/oz, 1.142 CAD/USD → $1,110 CAD/oz

·       2010: $1,224 USD/oz, 1.030 CAD/USD → $1,261 CAD/oz

·       2011: $1,572 USD/oz, 0.989 CAD/USD → $1,555 CAD/oz

·       2012: $1,669 USD/oz, 0.999 CAD/USD → $1,667 CAD/oz

·       2013: $1,411 USD/oz, 1.030 CAD/USD → $1,453 CAD/oz

·       2014: $1,266 USD/oz, 1.105 CAD/USD → $1,399 CAD/oz

·       2015: $1,160 USD/oz, 1.279 CAD/USD → $1,484 CAD/oz

·       2016: $1,251 USD/oz, 1.325 CAD/USD → $1,658 CAD/oz

·       2017: $1,257 USD/oz, 1.298 CAD/USD → $1,632 CAD/oz

·       2018: $1,269 USD/oz, 1.295 CAD/USD → $1,643 CAD/oz

·       2019: $1,393 USD/oz, 1.327 CAD/USD → $1,848 CAD/oz

·       2020: $1,770 USD/oz, 1.341 CAD/USD → $2,374 CAD/oz

·       2021: $1,799 USD/oz, 1.254 CAD/USD → $2,256 CAD/oz

·       2022: $1,800 USD/oz, 1.301 CAD/USD → $2,342 CAD/oz

·       2023: $1,940 USD/oz, 1.349 CAD/USD → $2,616 CAD/oz

·       2024: $2,160 USD/oz, 1.367 CAD/USD → $2,952 CAD/oz

·       2025 (April): $3,200 USD/oz, 1.390 CAD/USD (est.) → $4,448 CAD/oz

Vancouver Real Estate Prices

Annual average prices for single-family houses and condos in Metro Vancouver are sourced from REBGV, CREA, and WOWA.ca, with interpolation for missing years:

·       2000: House $300,000; Condo $150,000

·       2005: House $450,000; Condo $225,000

·       2010: House $800,000; Condo $350,000

·       2015: House $1,100,000; Condo $450,000

·       2020: House $1,500,000; Condo $600,000

·       2022: House $1,259,900; Condo $805,000

·       2025 (April): House $1,211,073; Condo $805,000

Intermediate years are estimated based on historical trends and market reports to provide a complete dataset.

Analysis by Period

2000–2005: Peak Gold-Adjusted Value

In 2000, a $300,000 house required 724 ounces ($300,000 ÷ $414), and a $150,000 condo needed 362 ounces. By 2005, houses at $450,000 required 836 ounces ($450,000 ÷ $538), and condos at $225,000 needed 418 ounces. This period marked the highest gold-adjusted value, driven by rising nominal prices and stable gold prices. Low interest rates, population growth, and foreign investment fueled Vancouver’s housing boom, making real estate appear exceptionally valuable relative to gold.

2006–2012: Gold’s Surge

The 2008 financial crisis propelled gold prices, peaking at $1,667 CAD/oz in 2012. In 2010, houses at $800,000 required 634 ounces ($800,000 ÷ $1,261), and condos at $350,000 needed 277 ounces. By 2012, houses at $950,000 required 570 ounces, and condos at $400,000 needed 240 ounces. Gold’s rapid appreciation outpaced housing, reflecting fiat currency devaluation as central banks expanded money supplies post-crisis.

2013–2020: Stabilization Amid Nominal Growth

By 2015, houses at $1,100,000 required 742 ounces ($1,100,000 ÷ $1,484), and condos at $450,000 needed 303 ounces. In 2020, houses at $1,500,000 required 632 ounces ($1,500,000 ÷ $2,374), and condos at $600,000 needed 253 ounces. Nominal prices surged due to low interest rates and strong demand, but gold’s strength kept the gold-to-housing ratio below 2005 peaks, highlighting the role of currency inflation in nominal price growth.

2021–April 2025: Declining Gold-Adjusted Prices

In 2022, houses at $1,259,900 required 538 ounces ($1,259,900 ÷ $2,342), and condos at $805,000 needed 344 ounces. By April 2025, with houses at $1,211,073 and gold at $4,448 CAD/oz, houses required 272 ounces, and condos at $805,000 needed 181 ounces. This sharp decline reflects a cooling housing market, high interest rates, and a surge in gold prices, amplified by ongoing currency devaluation.

Implications:

For Investors

The gold-to-housing ratio reveals a significant decline in Vancouver real estate’s intrinsic value, from 836 ounces for a house in 2005 to 272 ounces in April 2025, and from 418 ounces to 181 ounces for condos. This suggests that nominal price growth is largely driven by fiat currency inflation rather than real value appreciation. Gold’s resilience as a hedge against inflation makes it a critical benchmark for investors. In Vancouver’s supply-constrained market, local factors like zoning restrictions and foreign buyer policies continue to influence prices, but the gold perspective highlights broader economic trends. Investors should diversify portfolios with assets like gold to mitigate risks from currency devaluation and housing market volatility.

For Inflation and Purchasing Power

The disconnect between housing, gold, and the Consumer Price Index (CPI) underscores a decline in the purchasing power of money. According to Statistics Canada, Canada’s CPI rose by approximately 78% from 2000 to 2024 (base year 2002=100, from 100 to ~178). However, Vancouver house prices increased by 304% ($300,000 to $1,211,073), and gold prices in CAD surged by 975% ($414 to $4,448). This disparity shows that housing and gold have outpaced general consumer goods inflation, as measured by CPI. The CPI, which tracks a basket of goods and services, understates the erosion of purchasing power for major assets like housing. For example, a house requiring 724 ounces of gold in 2000 now requires only 272 ounces, indicating that real estate has become “cheaper” in real terms, while fiat currency has lost value against both gold and housing.

Decline in Real Incomes

The divergence between housing, gold, and CPI also points to a decline in real incomes. Median household income in Vancouver rose from ~$50,000 in 2000 to ~$90,000 in 2024 (Statistics Canada, adjusted for inflation), a nominal increase of 80%. However, this is roughly in line with CPI growth, meaning real income growth has been stagnant. Meanwhile, house prices have outpaced income growth by nearly fourfold, making housing increasingly unaffordable. In gold terms, incomes have also lost ground: $50,000 in 2000 was worth ~121 ounces of gold, but $90,000 in 2025 is worth only ~20 ounces. This erosion of purchasing power, coupled with housing’s declining gold-adjusted value, suggests that real incomes are not keeping pace with the true cost of major assets, squeezing affordability for most households.

Conclusion

Vancouver’s real estate market, when measured in ounces of gold, reveals a significant decline in intrinsic value, from 836 ounces for a house in 2005 to 272 ounces in April 2025, and from 418 to 181 ounces for condos. This trend highlights the impact of fiat currency devaluation, as nominal price increases mask a loss of real value. The divergence between housing, gold, and the Consumer Price Index underscores declining purchasing power and stagnant real incomes, making housing increasingly unaffordable despite its reduced gold-adjusted value. Investors and buyers should consider gold-adjusted metrics to better understand the true value of real estate.

Miika Makela, CFA

 https://www.linkedin.com/in/miika-makela-cfa-24aa056/ 

#vancouver real estate #real estate valuation #currency devaluation #purchasing power #real incomes #real estate investment

References

Real Estate Board of Greater Vancouver (REBGV). (2025). *Monthly Market Reports*. Retrieved from https://www.rebgv.org/market-watch/monthly-market-report.html

Canadian Real Estate Association (CREA). (2025). *Housing Market Statistics*. Retrieved from https://www.crea.ca/housing-market-stats/

WOWA.ca. (2025). *Vancouver Housing Market Analysis*. Retrieved from https://wowa.ca/vancouver-housing-market

GoldBroker.com. (2025). *Historical Gold Prices in CAD*. Retrieved from https://goldbroker.com/charts/gold-price/cad

TD Precious Metals. (2025). *Historical Gold Price Data*. Retrieved from https://www.td.com/ca/en/investing/precious-metals/

Bank of Canada. (2025). *Annual Average Exchange Rates*. Retrieved from https://www.bankofcanada.ca/rates/exchange/annual-average-exchange-rates/

Statistics Canada. (2025). *Consumer Price Index, Historical Summary*. Retrieved from https://www.statcan.gc.ca/en/subjects-start/prices_and_price_indexes/consumer_price_indexes

Statistics Canada. (2025). *Household Income Statistics, Vancouver CMA*. Retrieved from https://www.statcan.gc.ca/en/subjects-start/income_and_expenditure

X Platform. (2025). *Posts on Gold Price Trends, April 2025*.  Retrieved from https://x.com/

Share this article
The link has been copied!